The last week has been the overload of presentations, participation and socialising that is the annual Tableau Conference – ubiquitously known as #TC18. As 17000 people descended on New Orleans it represented an amazing opportunity to learn, meet new and existing friends and be inspired for the future. And, what an amazing city to host such a celebration of all things data and visualisation!
A huge thank you to all who made me feel welcome and took this Englishman abroad under their wing, to those who took the time to talk to me and those who went above and beyond. It feels like to mention one person would be to exclude ninety-nine (and probably many more), so I hope that I know who you all are and that you appreciate my thanks. To all of you, stay in touch and bring on 2019! Instead I want to focus on my takeout learnings from the conference itself, and my resolutions as a result.
Be more Zen
Since being awarded the title of Zen Master earlier in the year I’ve dealt with it mostly with two emotions: pride, and disbelief. Being Zen has a number of specific responsibilities at Conference in particular. There is the opportunity to give presentations (more on that later), the requirement to do a “shift” in the Zen Garden area of the community, and there is a Zen Summit where we have the opportunity to talk to development team and represent the community’s thoughts and ambitions for future features. In addition was the chance to be presented on stage to 17000 people!

I’ve kept the disbelief element away from this blog: there have been a number of times when I’ve felt the inevitable “impostor syndrome” at being one of just 30 current global Zen Masters. That still permeates – especially at the Zen Summit where I am in company of 20+ others (only a handful of Zens didn’t attend) who are among those I look up to most. Their experience, knowledge, technical ability and influence with those at Tableau dwarf me in every category. I need to learn that I have been chosen, not just at random, but by Tableau to be among this company for the same reasons as all of the others and am there by right. Two years ago I attended Tableau’s conference as a lucky competition-winner and at times I felt the same this year – like a “fan” of the software who is just grateful for the opportunities it has brought me, rather than a person who wants to push for even more features and functionality. I do know that’s not the case … but I will continue to work on it and am grateful for the opportunity. It was a pleasure to meet the developers for the first time, and should I be in a position to do so again next time, I hope I can do so from a position of lot more experience and confidence.
Here’s another case in point – talking at the Zen Garden with customers. I’m confident enough to talk to any clients or attendees who’d like to talk to me, but also very conscious of my limits. On Thursday, I watched in awe as the wonderful Ken Flerlage got out his laptop and worked hands-on with a client in reproducing a complex circular visualisation they wanted to work on. Ken and I have similar skills and interests in Tableau, and it was also the kind of visualisation I’d have been interested to create. But those are the kind of visualisations I have always done over time, with an iterative approach, at home, until I got the desired result. Ken worked at speed and engaged the client and I peeked over his shoulder as the viz took shape. While not everything worked straight away, I heard him say “Let’s keep going, I’m still enjoying myself” and the client was engaged and happy as Ken eventually worked towards a pretty impressive and speedy result.
But though I felt I would have struggled in that situation, at the same time I spoke to two people from a university from the US. They showed me bar and line charts, asking me if there was anything that could be done to improve their offering. I didn’t get out my machine and create anything, but I did enjoy the discussion. I shared experiences of working in Higher Education dashboards (my day job) and enjoyed leading the discussion around ways they could introduce scatterplots and other ways to benchmark and disaggregate their data. I borrowed a scrap of paper and pencil and started to think visually and saw the clients’ eyes light up as some of the ideas resonated (they were not even the first people I spoke to about how good and how useable Ivett Kovacs’ magnificent flower petal visualisation is). And I was able to recommend a book to them on sale just feet away (Steve, Andy, Jeff I’ll take my commission for the Big Book of Dashboards next time we meet!).
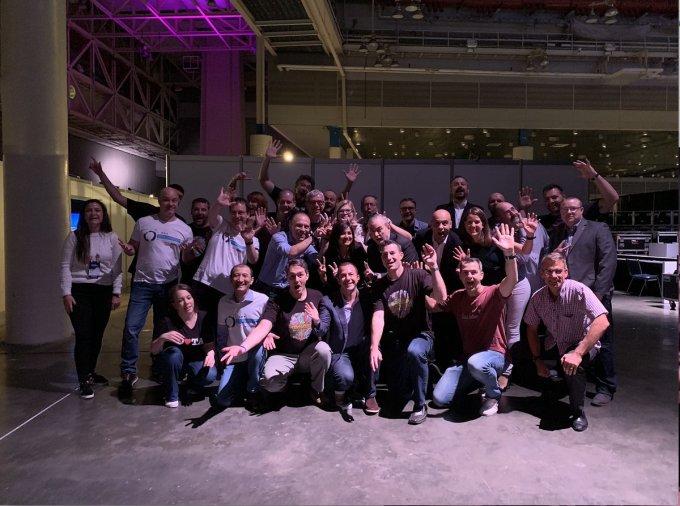
It wasn’t all about the impostor feelings though – I did feel proud to be announced on stage and to have the opportunity to give my own presentation. It remains my intention to continue to grow and contribute so that I may be considered next year and in the future. It’s a great honour and I’m not about to give it up easily! This photo of the Tableau Zen Masters present (I’m in there somewhere) was tweeted out by Tableau’s CEO Adam Selipsky. If I can’t be proud of that, what *can* I be proud of?!
Collaborate more
Many of the best sessions at conference were presented by pairs of two, offering alternative perspectives or expertise. Examples included Mike Cisneros and Alicia Bembenek on the mentor/mentee process; Jonathan Drummey and Jeff Bernson on the Zen/client collaboration for PATH, or Lorna Eden and Ann Jackson teaming up to deliver twice the skill and entertainment in fast-moving tip demonstrations. While all this was going on, I received several offers to collaborate.
Before Conference I was starting to formulate ideas of who I might want to collaborate with but have done nothing about it. But now I have ideas from people who want to collaborate on future projects, for talks at the next Europe Conference, and for a talk at the 2019 US conference already. My instant reaction in all three cases was “yes”. All three are from those I admire who would, in a shot, bring extra quantities, skills and experience as a pair than I can offer just by myself.
So whether it’s future Tableau Public visualisations or future Conference presentations, look out for twice as many people!
Keep Presenting
This one is an easy one for me. As already alluded to, I really enjoy giving presentations. It’s a worthwhile experience that I would encourage anyone to do. My own presentation, on Design Driven Data, is already available online:
Presenting is daunting at first – like so many in the data and visualisation field, give me a Myers Briggs test and I will identify as an introvert any time. But presenting puts you in control: you present on a subject that, in the form in which you have decided to present it, you know more about than anyone else in the room.
My own talk, in a large arena, was in front of almost nobody I knew. Session clashes and other commitments meant that, almost in entirety, the audience were made up of those new to me and I would imagine that they were therefore mostly unaware of who I was or the kind of things I like to create. I felt the session went OK, but with no questions at the end of the talk, had it been well-received? After all, the lighting arrangements had meant that I couldn’t see a thing, only bright spotlights!
I needn’t have worried – the highlight for me was the fact that about 10-15 people came to the front and patiently queued to talk to me with their own comments and questions after the presentation. It seems I’ve helped to stir creative ideas that people have, and it was great to chat to some new people and send them away with some new ideas. A surprising conference highlight for me came on Friday after everything had finished. A Friday meeting over breakfast with good friends was a fabulous way to wind down, but after a few emotional farewells to friends I may not see for a while, a lady who had been patiently waiting in the hotel lobby came up to me to say how much she had enjoyed my talk. That made my day almost as much as a Cesar Picco bear hug
Be more Giorgia
They say never meet your heroes. But when you bump into them in the New Orleans Superdome, what are you going to do?!
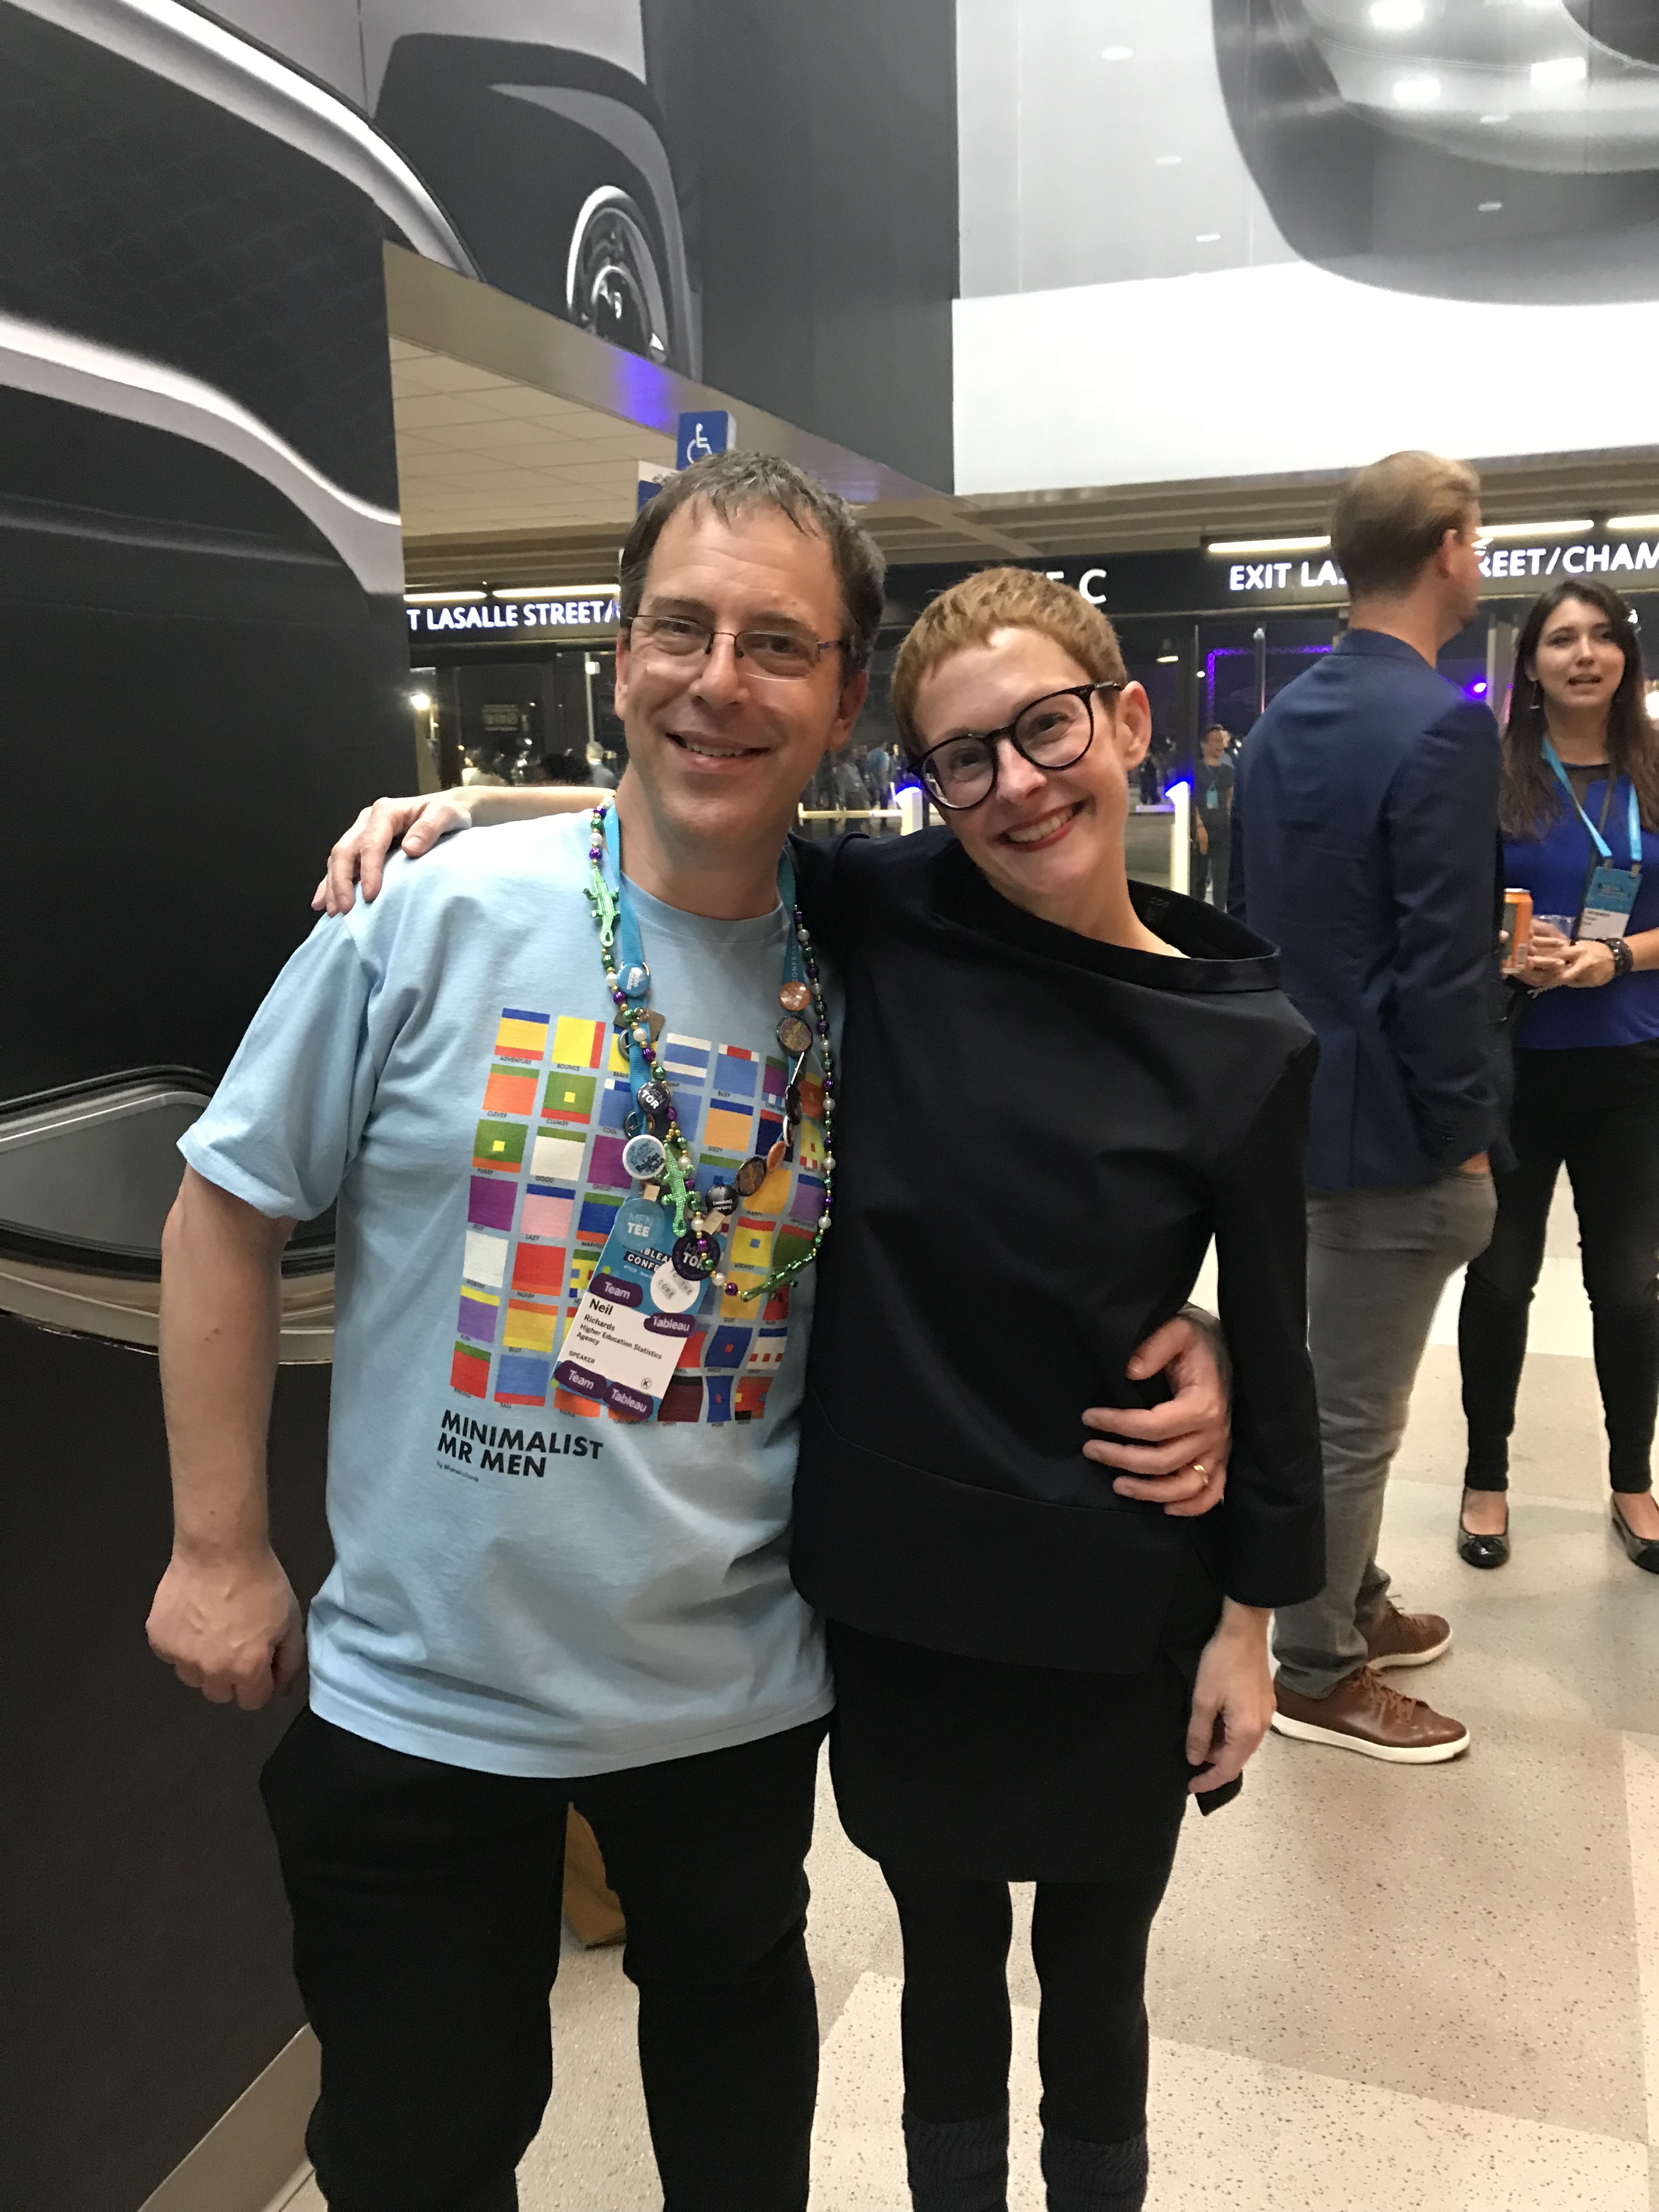
My undoubted conference highlight was the talk from guest speaker Giorgia Lupi. For those that follow my work, that won’t be a surprise. After all, the design driven data theme of my work and talk is borrowed from Giorgia’s concept. I moved my scheduled speaker slot and ducked out of a lunch with Adam Grant so that I could watch her talk. Inspiring and rammed full of content, it was everything I hoped for. In terms of content, I’m not sure it was recorded, but it reprised much of the talks available from her TED talk and other conference speeches. But seeing the talk live was another experience, which led to tears and a standing ovation (from me, yes, but not just from me).
It was instructive to me to see how many other people shared this reaction with me, from those who I knew were big fans before the talk, to others who were learning of her work for the first time (I was glad to learn that at least a couple of people went on my recommendation due to referencing her work in my talk).
Here is a similar data humanism themed talk from earlier this year which covers much of what she spoke about.
So how do I become more Giorgia? Giorgia’s work is amazing and some of it has the work of the Accurat studio behind me. But there are a few things I can do:
- Always consider the human side of data
- Lead with the design
- Work on and create an unmistakeable and inimitable style
- Learn how to include and present with animation and transitions
- Further open my mind to connecting art and music with visualisation
- Start by creating my data portrait
- Draw more (this is hardest for me – my copy of the wonderful Observe, Collect, Draw is still pristine!)
- Smile, be humble, be generous, share, and have fun!
Train, teach, inspire
I’m a great follower in life, but not a great leader or instigator. I took much inspiration at Tableau Conference from those who were able to lead others and share their experiences. Chantilly Jaggernauth and Amar Donthala spoke clearly and with pride about the Millennials and Data initiative they have set up and run, despite their combined ages being, I suspect, little more than my own. Mike Cisneros and Vince Baumel independently inspired us to take part producing public work in the community with presentations of mike-drop intensity and passion. Andy Kriebel and Eva Murray have converted the incredible Makeover Monday project into a book, which I’m delighted to be a tiny part of. We learned from those who train, those who teach and those who run community evens such as Tableau User Groups.
For the “inspire” part of the above, I hope I can continue to do so. But for the “train” and “teach” bit, my own experience in these areas needs to grow. If chances to lead community events or run training sessions and workshops, I need to take them, to move my own experience and engagement experiences up yet another level.
Stay connected with the wider visualisation community
The Tableau Conference clashed with the IEEE conference in Berlin last week. This feels like a shame – I’m not saying that if the two didn’t clash I would’ve been able to make the IEEE visualisation but I would certainly have been following the feed more closely. I’m probably fairly unusual in the Tableau community inasmuch as my first love (in this field) is data visualisation/data art in general, with Tableau and data analytics a joint second.
Jon’s tweet above acknowledged that there was a need for collaboration in communication. The IEEVIS conference is talking about dashboards, after all, what could be more Tableau? My resolution must be not only to watch the recordings of all the Tableau talks I missed this week (well, not all, as there are now over 200 talks recorded and available online here) but also to keep my eye open for IEEEVIS recordings too.
I genuinely believe that Giorgia’s inclusion was a great step in bridging the gap between the Tableau bubble and the rest of data visualisation but I do think it’s important that those of us with the same love of tool-agnostic visualisation keep the middle bit of that particular Venn Diagram alive. From my own personal point of view, I’d love that to be with the help of some collaborative projects. I’ve downloaded Illustrator and dabbled in d3.js and win both cases I have courses ready to take. But as my work life and Tableau projects get so busy I leave the courses unstarted for now. But I need to find time to broaden my visualisation skills across these, and other methods. Why not?!
And finally …
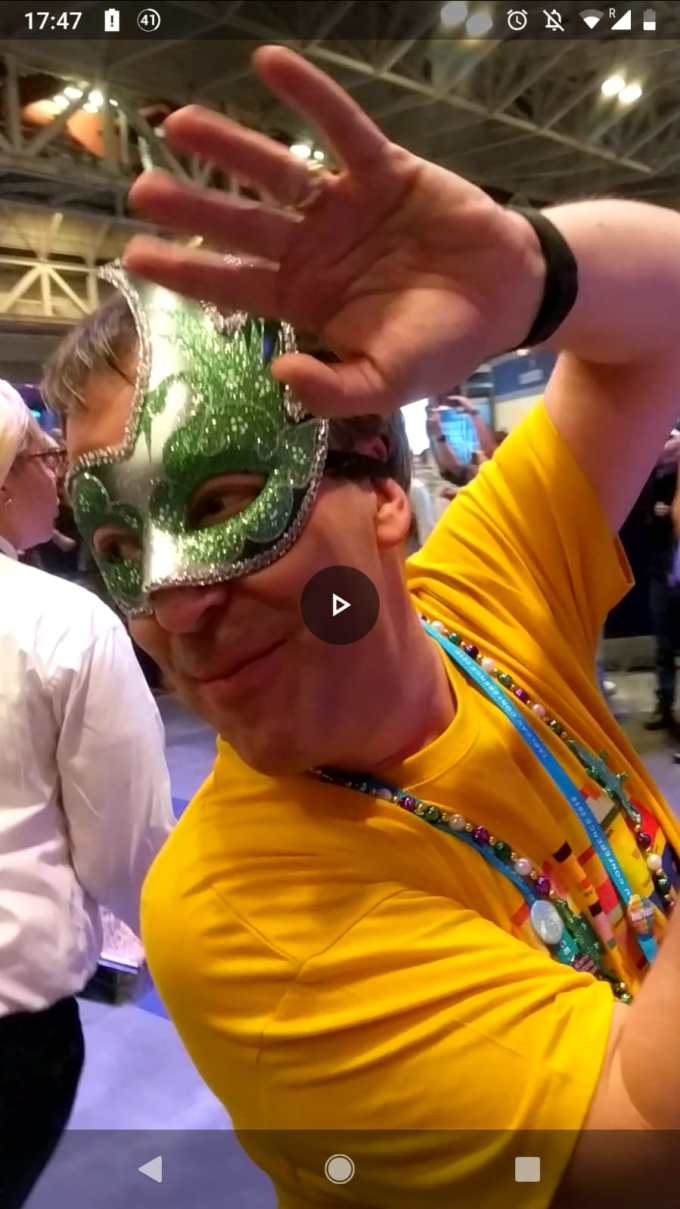
After six things to take inspiration from into the future, here is one thing I’m never doing again. As a grumpy middle-aged Englishman I was determined not to enjoy this. But, secretly, I did …

5 Comments