This post is an impressive piece of procrastination even for me, being over fourteen months in the making, starting from a podcast interview I gave with Alli Torban in November 2022, but I’ve been able to resurrect, rewrite and complete it with the launch of Alli’s new book: Chart Spark.
Coinciding almost exactly with the launch of my Questions in Dataviz book, we spoke back in the aforementioned podcast about ideas and rituals around trying to be creative. You can find the link to our podcast chat, as well as the transcript and show notes at this link:
https://dataviztoday.com/shownotes/81
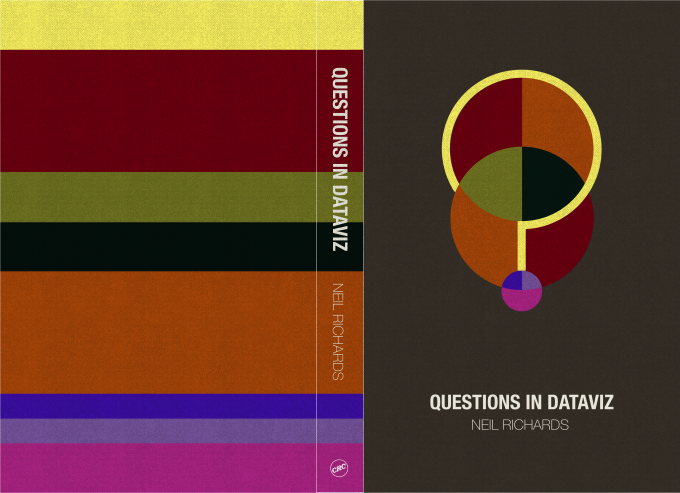
One of Alli’s great skills is to be able to elicit ideas and summary suggestions from people that her interviewee hadn’t thought of, or been able to put into words or designs. I already knew this at first hand, because it had been Alli who I turned to when I wanted an awesome book cover design! Alli was able to take ideas I didn’t even know I had, and instantly produce the book cover logo I still love seeing, as described in my previous post:
And although when we spoke, I didn’t really know my own thoughts on creativity in clear form, by the time the podcast was published, we had six takeaways of my own thinking as advice that Alli curated and summarised from our talk, which she themed “Off the beaten path”.
1. Creativity is about seeing the usual path, and then taking a different path
We associate being “creative” with being “different”. The two aren’t the same thing (for example, not everything different would be considered creative), but there is usually an element of difference to being creative. You therefore need to learn skills, understand and develop them, because this will help you be prepared and navigate new paths (and have the tools to move off the beaten path).
2. Creativity isn’t binary, it’s a sliding scale
It’s not just a matter of a project or visualisation being considered creative or otherwise, and we shouldn’t feel pressure to tick a binary “creativity” box with every project. I’m often uncomfortable when people describe me as “artistic” or “creative” although it’s something I have always aspired to be in my work. But if and when you need or want to, consider your previous projects and try to become more creative than the day or project before – it’s a lot less pressure.
3. I approach creativity by adapting what I see
It’s so rare that creative ideas are brand new and unique, and everything comes from inspiration from something existing: A couple of examples of effective ways to think of new ideas that we spoke about: firstly combine different ideas and putting them into your own style; secondly, take something from one industry and bring it into another.
4. Constantly ask yourself the question “why”?
This can also help get you off the beaten path for your next project or dashboard and explore new paths – maybe it will work, maybe not, but you won’t find the creative idea if you don’t try. Questioning is absolutely key to the process of adapting and becoming different or creative. Of course, my whole blog and book have been based around questioning processes and principles, and why you may want to try things in a different or unconventional way (or, why you might not!)
5. Think about the times when you do have creative ideas
In practical terms, you can optimise your creativity around these times of day when you feel most creative, or around the tasks you undertake when you’re at your most creative. Conversely, when you’re more tired or less creative, schedule your execution tasks. This is a good practical way to optimise creativity – this will definitely be different for all of us based on our physiology, our routines and our lives.
6. Creative rituals … do I have any?
Not really, but I have habits/schedules!
We were both quite disappointed that I couldn’t come up with much tangible in the way of creative rituals, since this is what Alli was particularly interested in for her (then) future book. And it’s this book, Chart Spark, that I’m now the proud owner and about-to-be-reviewer of. It’s true that one sentence of my advice does make it as a mention in Alli’s book. I won’t recreate it its exact wording here, if you’re genuinely interested you can buy the book! But if you’re at all interested in creativity in data visualisation, as I suspect most regular readers and subscribers to this blog will be already, you should buy the book anyway.

Because I knew twice already, from personal experience firstly from working on my book cover and secondly from taking part in the podcast, how skilled Alli would be in turning ideas into a finished product, I was excited to be able to read and review this book. Chart Spark is a curation of ideas, processes, instructions and more, which all help with the creative process in data visualisation. Focusing particularly on Alli’s experiences as a freelancer, the focus on creativity is broken down into three further Cs: Care, Coax, Communicate.
One of the first things you notice is that almost every figure and image in the book is hand-drawn. This touch immediately makes the book feel personal – you feel instantly that these are ideas and pieces of advice from Alli’s own thoughts and experiences, rather than repeated parrot-fashion from other textbooks. Here’s a great example simply explaining the need to include rest in the cycle between ideation and execution, and the cyclical nature of the whole process.

And my favourite practical advice from the book is the X-RAY mnemonic and prompt. Find a graphic that you find particularly inspiring and analyse it using the following criteria:
X: what got you eXcited?
R: how are they following dataviz best practices and Rules?
A: Anarchy – how did they throw out the rules?
Y: How might You use this in your own work?
By the way, I love how an important consideration for creativity is anarchy. As you can imagine, that fits with my brand nicely!
I thought I would try the X-RAY technique on Data Yarns, by Daniele Gibney. I’ve chosen this because I was excited when I saw this shared on social media a few days ago, but as is so often the case when you see something pass by in your feed, I haven’t acted on it in terms of how it made me feel or what ideas it inspired in me. The image represents all the books Daniele read in 2022, with details and explanation on her blog post here:

So, let’s do the X-RAY process here quickly:
eXcited: The visual appeal, colour and geometry and non-traditional medium got me excited. Physical data visualisation was one of the first things that really drew me into dataviz, I just love the aesthetic.
Rules: In terms of best practices, it’s a great example of small multiples, with a clearly defined scheme for each colour, positioning and shape. A lovely example of data portrait-style visualisation …
Anarchy: … but we don’t immediately know what those rules are! Yes, there’s a system but it’s not part of the immediate viz. You need to visit the web page to understand and decode the visuals. We’re just drawn to the art and aesthetic, and I love it! And, it’s cross-stitch rather than on-screen, if that’s not anarchy, what is?!
You: It’s immediately made me want to do two things. First of all, this would be an amazing way to represent my own books and book reviews, which this post is already part of. Once I hit 24, or 25 reviews, I’ll have the perfect number to represent in a grid. Second, I need to act on my love for physical dataviz. As a resolution for 2024, why don’t I create more physical dataviz? I haven’t cross-stitched for 43 years, but 2024 could be that year? (Reader, this isn’t a promise or a resolution by the way … but I am inspired to, and who knows?!). You can tell from the rambling nature of this section that it’s been the seed of a number of creative inspirational thoughts already, and this exercise helps to record and formulate them.
There are many more tools curated and explained to take you through the full process. The Care chapters focus on essential elements and habits to care for your creativity (including the X-RAY prompt among others), and the Coax chapters then work on questions and prompts to coax out those creative ideas. The Communicate chapters introduce you to tools to help communicate those ideas in infographic or dataviz form, such as different dataviz types and media, and the importance of visual metaphors.
To conclude, Chart Spark is a book which feels full of personally curated advice but that can help you take inspiration for creative data visualisation. It’s not a large or overwhelming book, to the extent that I sat down and read it in one long session, but it leaves you knowing that it is full of tips to dive back into whenever you need to look for or remember advice on getting started or presenting your creative dataviz. The subject couldn’t be closer to my heart in terms of what I love to think about and partake in, and so if you share the same interests in creativity and data visualisation, you will want to own this book (alongside Questions in Dataviz, of course) for your own collection.
