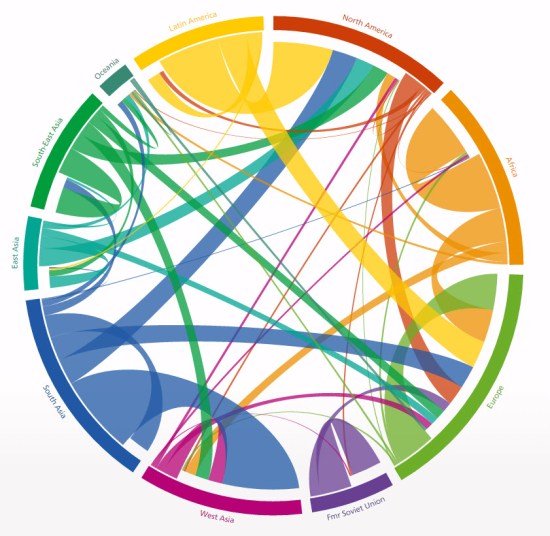
I have a number of dataviz questions I still want to cover, but this has usurped a few others and moved right to the top of my list for the moment. The debate focuses around this chart here, published at http://www.global-migration.info/ You can probably skip to the concluding statement of this post (which I haven’t […]
Author: Neil
What did I learn from Tableau Conference 2016? (part 2)
Part 1 was posted a few days ago here, featuring numbers 1-8. We’ll jump in at number 9. 9. Tableau is moving into data preparation. With the announcement of a three-year roadmap followed by the developers on stage, Tableau announced a raft of new features large and small. These are all well documented now in […]
Why don’t people tell the truth?
I don’t want to make this too emotive – I’ve already toned down the title from “Why do people lie?” But, why indeed? There are probably a thousand psychological reasons but I’m asking in just one specific context: opinion polls. I’ve often said that it’s impossible to be interested in data visualisation without taking an […]
What did I learn from Tableau Conference 2016? (part 1)
Last week, I had the great fortune to attend Tableau’s yearly conference, in Austin, Texas. In the interests of disclosure, I should say that my entry was paid for by Tableau, as winner of an entry competition. With so many sessions to attend, things to learn, speeches to hear and people to meet, I’ve tried to […]
Is it OK to steal?
So, is it OK to steal? Of course not. In the data visualisation context, that would be passing someone else’s work off as your own. Anyone would agree that would be the wrong thing to do. But that would make a very short and uninteresting post. At the very least, I’m shooting for quite long […]
When is a visualisation a call to action?
This question and therefore this post has come about as a result of a conference talk I am giving tomorrow. The overall conference theme is the Culture and Politics of Data Visualisation and I’m excited to have been asked to talk at an event for the first time. Specifically, my talk focusses around my professional […]
How important is creativity in a data visualisation?
Because the gimmick of this blog seems to be to pose and answer a question in every post, I wasn’t sure whether to ask “How important is creativity …?” or “What is creativity …?” but either way creativity in data visualisations is what I want to talk about in this post. A little while ago […]
What is Makeover Monday?
I probably mention Makeover Monday (or, to give it its twitter name – #MakeoverMonday) quite a lot in passing, so this is a post not just to explain what it is, but how it has helped me, both in terms of my skills and confidence in Tableau in particular, and in terms of becoming part of […]
Where are the Africa grid/tile maps?
First – before anyone writes in, it’s possible that there are Africa grid maps out there. But I haven’t seen any. And second, I’m not certain whether you’d call these grid maps, tile maps or both. For the purposes of this entry I’ll probably alternate between both terms. Anyhow, last week I wanted to visualise […]