AI is pretty much everywhere these days. As I type, AI is trying to help me create this blog post. I’m writing this post from the point of view of someone inquisitive with AI – I don’t consider myself a pioneer or an expert user, but I’m happy to dip my toe in the world of AI. I’m certainly trying not to be too sceptical and shun it entirely. In case you were wondering … I choose not to use AI to help with my posts (or my book writing), so my stubbornness here remains. But in the process of dataviz, and personal creative dataviz in particular, I’ve reached the stage of wondering how it could help me.
A recent post by Adam Green in his wonderful CoffeeTableViz blog here explored how he could use ChatGPT to help him reach his final Shades of Heroism viz. I don’t consider myself strong at all when it comes to data scraping, extraction or manipulation – I am usually slow, methodical and low-tech when it comes to the process. Could this be where ChatGPT helps me?
My comfort zone for personal visualisations using simple large-ish datasets is simple letters, words or numbers. A couple of years ago I visualised Wordle results among my family. Now I’m back playing Wordle amongst a group of friends, so wondered if I could visualise all the Wordle words so far, using the list of words found here on rockpapershotgun.com (for those of you like me who still play regularly – it’s a very useful page indeed!)
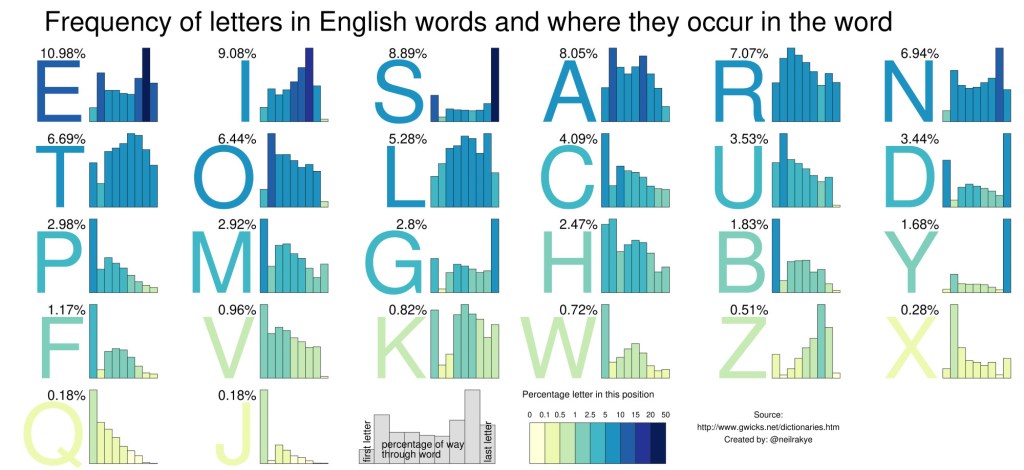
I’d recently rediscovered this awesome visualisation from Neil Kaye – about letter distribution and position in words. This could be a nice thing to take inspiration from, with the bonus of a more simplified structure knowing that every Wordle word is exactly five letters long.
I turned to ChatGPT. It took me just two attempts to get the data in exactly the format I wanted it. I pasted the string of data from the site into the following prompt: “Please create a dataset from the following words “ABACK ABASE […] ZESTY” separated by letter and position in word. Please create one comma separated line per letter. Please use the letter as the first field, the word as the second field, and the position in the word as the third field.” (Yes, I try and use “please” and “thank you” when speaking to GPT – don’t you?)
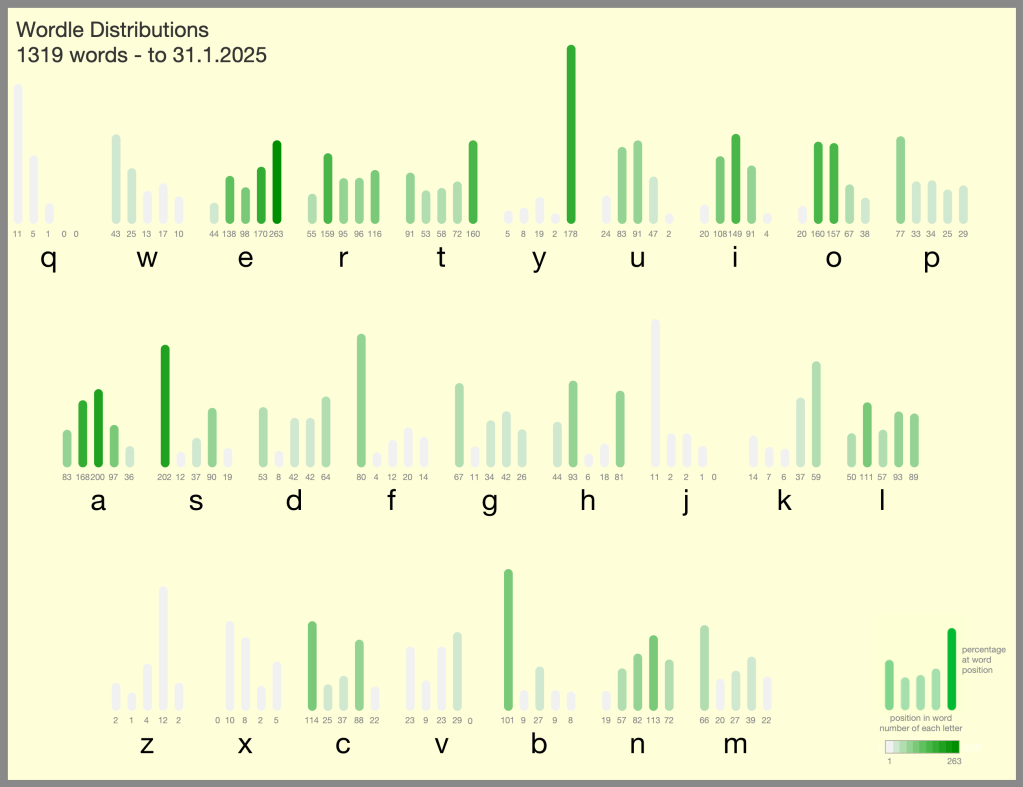
In less than a minute, I had my dataset. I think I knew it should work, but as the first time I’d tried something like this, I was somewhat blown away by how well it went. It was a lot quicker and easier than I could’ve expected. Just one attempt at the prompt, followed by one follow-up iteration, and I had my 6000+ line dataset in exactly the format I wanted it. After work in Tableau to stylise it into my preferred design, I created the visual below with the the Neil Kaye inspiration that I wanted:
Thanks to AI, and ChatGPT specifically, I had my dataset which I knew would be fun for experimenting on more types of dataviz and data art – why stop there? I wanted to disaggregate and show a datapoint for every word. How could I take each letter and show the distribution of letter positions with a mark for every word?
I thought of showing something radial for every letter, maybe a flower design for each letter with each petal representing a letter position. But pentagons are tough and don’t pack properly for individual shapes. Circles and hexagons pack nicely into hexagons though. I wondered if I could show word positions 1 through 5 as five segments of a hexagon (with the sixth blank, for the letter label). I could arrange every letter occurrence into a triangle, and pack the five triangles together.
But that’s not trivial. Suppose I have a number, say 168, for the number of words with A in position 2. How do you determine the size of triangle, and position of every one of these 168 individual hexagons within that triangle?
ChatGPT helped me with that in almost no time at all, instantly giving me what I needed for my Tableau calculations. I asked: “I have n circles area 1×1 that I want to arrange in a triangle array. What is the formula for the position of the nth ball?” – the answer was clear with detailed and friendly explanation. It seems I’m not the first person to ask about what’s known as the ball-packing problem! Minutes later, my words were all represented as circles (which I changed to tiny hexagons) all packed into triangles of appropriate sizes. I then couldn’t remember how to rotate my coordinates round a certain number of degrees based on letter position 1-5 … but you can guess where I got my answer from.
My finalised visualisation with hexagons packed into triangles is here:
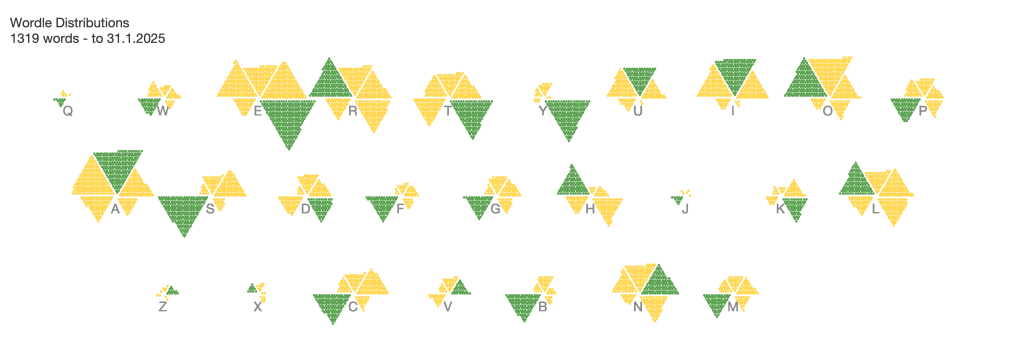
You’ll notice I haven’t updated this with title and prettied it up completely. The final viz looked how I intended (each letter is shown with position 1 through 5 clockwise from top left of the letter, with green for the letter position with most words), but I then wasn’t convinced about presenting it out to the big wide world. Nevertheless I was delighted about how quickly ChatGPT had helped me with the tricky bits and thought processes to get there.
I still wanted more ideas – something that moved away from the predictable Wordle green/yellow and something more abstract and colourful. Something more “me”! Some data art that could be generated from our Wordle word list. I wondered what a mosaic of tiles could look like with 26 different colours. Now I know that’s far too many colours for best practice, but it’s no secret that I’ve written a lot of blog posts and an entire book which suggests that I don’t always feel the need to stick to best practice.
I started by asking ChatGPT to show me a grid of tiles using 26 colours (below). Nice – it even showed me literal tiles! I then asked for a specific size of 40 x 33, which is the closest approximation I have to the number of words in my dataset. I wasn’t sure where this was getting me, but using AI in the exploratory phase of ideas was allowing me to iterate a lot more quickly that I would often be able to do otherwise. It prompted me to ask ChatGPT for a colour palette optimised for 26 colours.

The colour palette was generated but not after ChatGPT explained to me that “An optimal 26-color palette should include a diverse mix of distinct, well-balanced colors that avoid excessive similarity. Here’s a carefully selected palette with good contrast and variety:“
It is of course important to note that we shouldn’t take its output as gospel with checking. The palette, when tested in Tableau, did seem to fit the brief though. With 26 colours, some bright, some pastel, all just about distinguishable, I then assigned each letter to a different colour and began with some ideas of how to tile out the words.
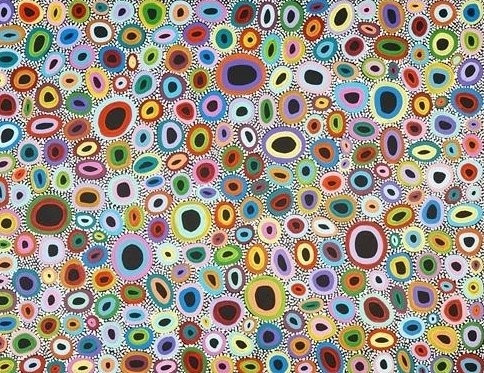
My next idea was to take inspiration from some of my most favourite colourful and abstract art. I’d been wondering how to incorporate something like the following: Bush Flowers, by Australian indigenous artist Raelene Stevens has long been on my dataviz inspiration list.
But my GPT help wasn’t over – for all my thoughts about random-looking mosaic patterns of 26 colours I suddenly realised that my data was in alphabetical order. I needed a random ID from 1 to 1319 assigned to my data. You guessed it – I asked ChatGPT to produce this for me and updated my data.
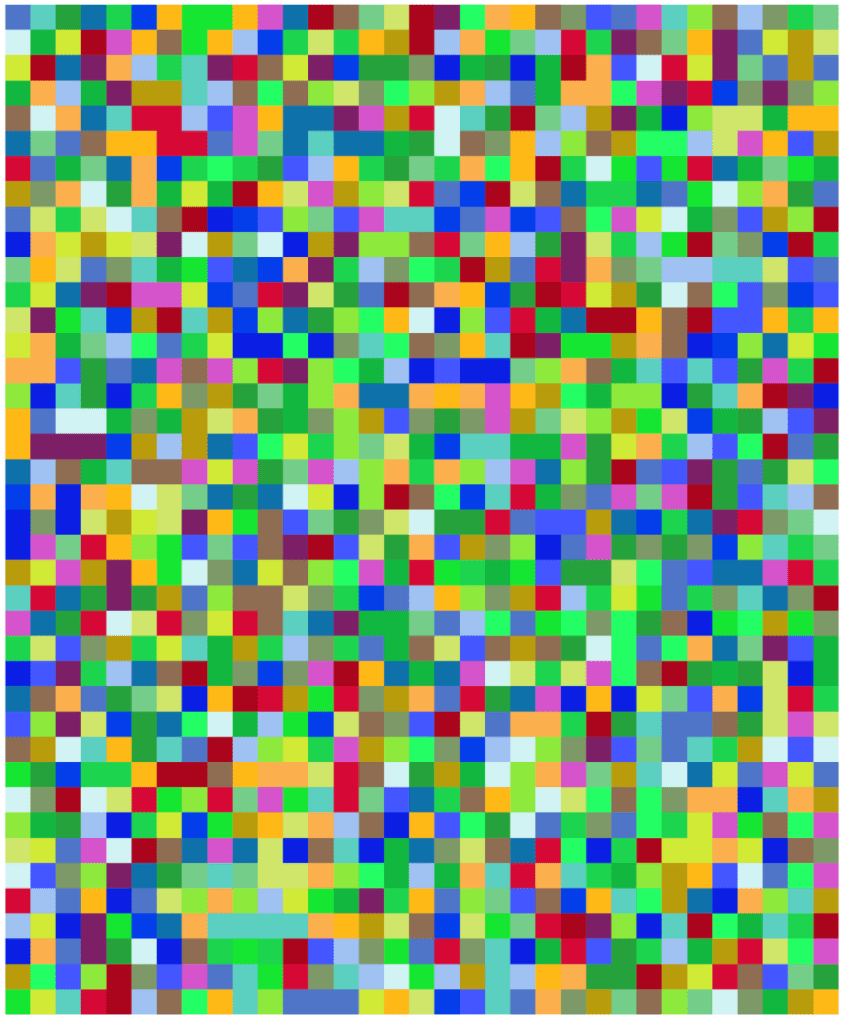
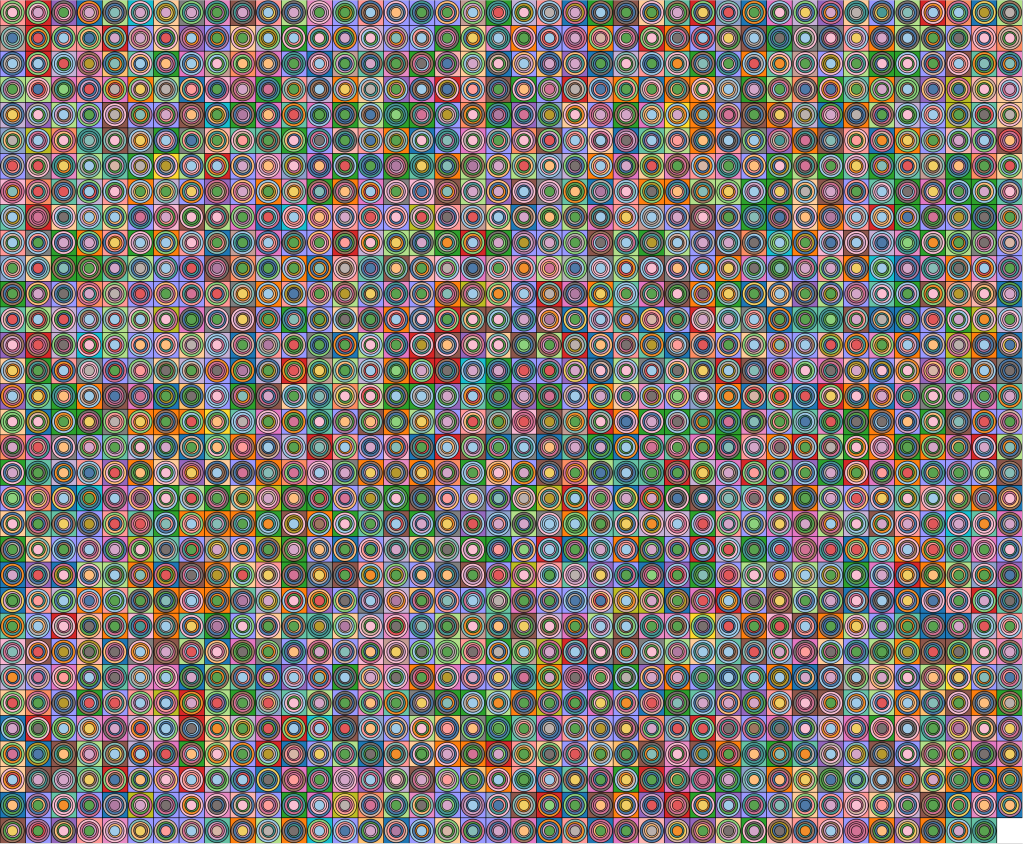
Now my version below is far more uniform than the much more organic version above, but by incorporating a large colour palette and focusing on concentric circles, I’ve loosely been able to some inspiration from this fantastic art piece to create my own data art visualisation.
With every background square representing the colour of the word’s first letter, the four concentric circles represent letters 2 through to 5 in order. The 40 x 33 grid represents the list of 1320 words positioned randomly (well, 1319 with a blank in the bottom right hand corner!).
All three visulisations can be found on Tableau Public at https://public.tableau.com/app/profile/neil.richards/viz/wordle2025/WordleLetters3 (cycle through tabs to see all three)
The use of ChatGPT has shown me that AI can help with data scraping, with technical and mathematical aspects, and with colour and design choices. All things that could have been done with coding, with ETL software, or with more traditional Internet searches. But it saved me doing things I’m either not very good at, or that would’ve taken me quite a bit of extra time. I don’t claim that any of the visualisations are ground-breaking or award-winning. That part of the process needs human input, creativity, expertise and skill from me, the practitioner. And I never actually asked GPT to visualise the data – maybe I didn’t want it to come up with something clearly better than I could! But it does feel like this is just the start. In a good way, I think!

2 Comments