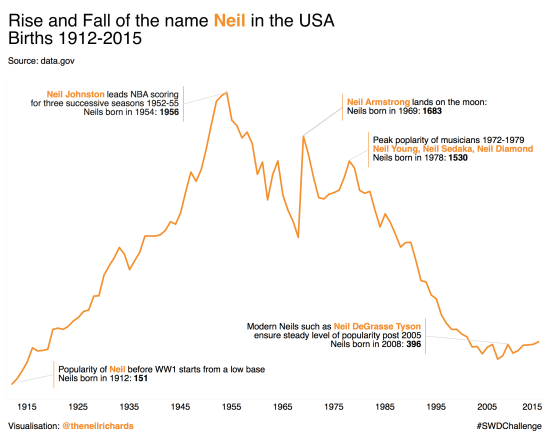
Today’s blog post focuses around a visualisation challenge set by Cole Knaflic, author of the seminal work Storytelling with Data. This year she is setting a monthly challenge, with the first challenge set out here The challenge is simple. Using any data you care to source, create (and share) an annotated line graph. As is […]