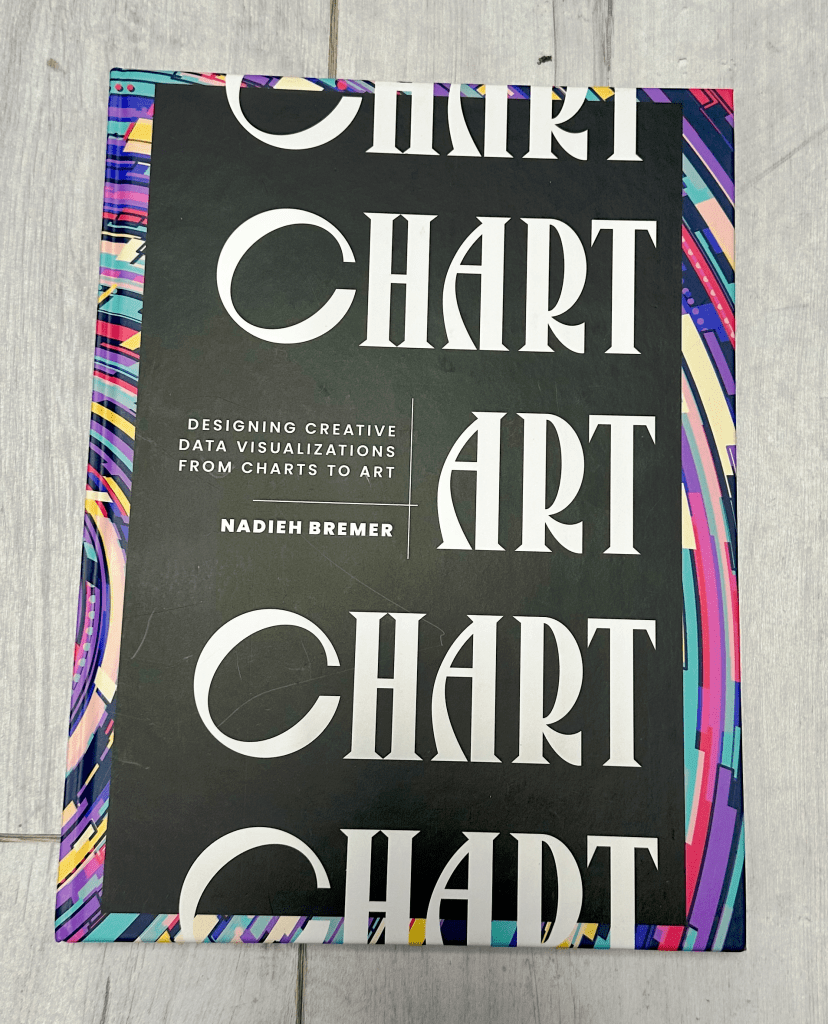
ChART is Nadieh Bremer’s second book, following on from Data Sketches, co-authored with Shirley Wu and released in 2021. The simple title is explained by the subtitle: Designing Creative Data Visualizations from Charts to Art and looks at the scale of Nadieh Bremer’s work along a spectrum from charts to full on data art. I’ve reviewed over thirty books on this site now, and, counter-intuitively, this is going to be one of the hardest books to review. And that’s because I’m a big fan!
I love Nadieh’s work – I have always classed her work as a great personal inspiration for getting involved in data visualisation. Data Sketches encouraged me to write my own book in the AK Peters series, and if you want a TL:DR of this review – I know that I’m going to write that the book is amazing. Even though I haven’t written the rest of the review yet, I’m pretty confident that will be my conclusion. Having been involved as a beta-reader, I’ve already had a chance to offer feedback on the draft version of the book, so much so that my endorsement forms literally the first words in the entire book. You can consider that as a second, alternate TL:DR!

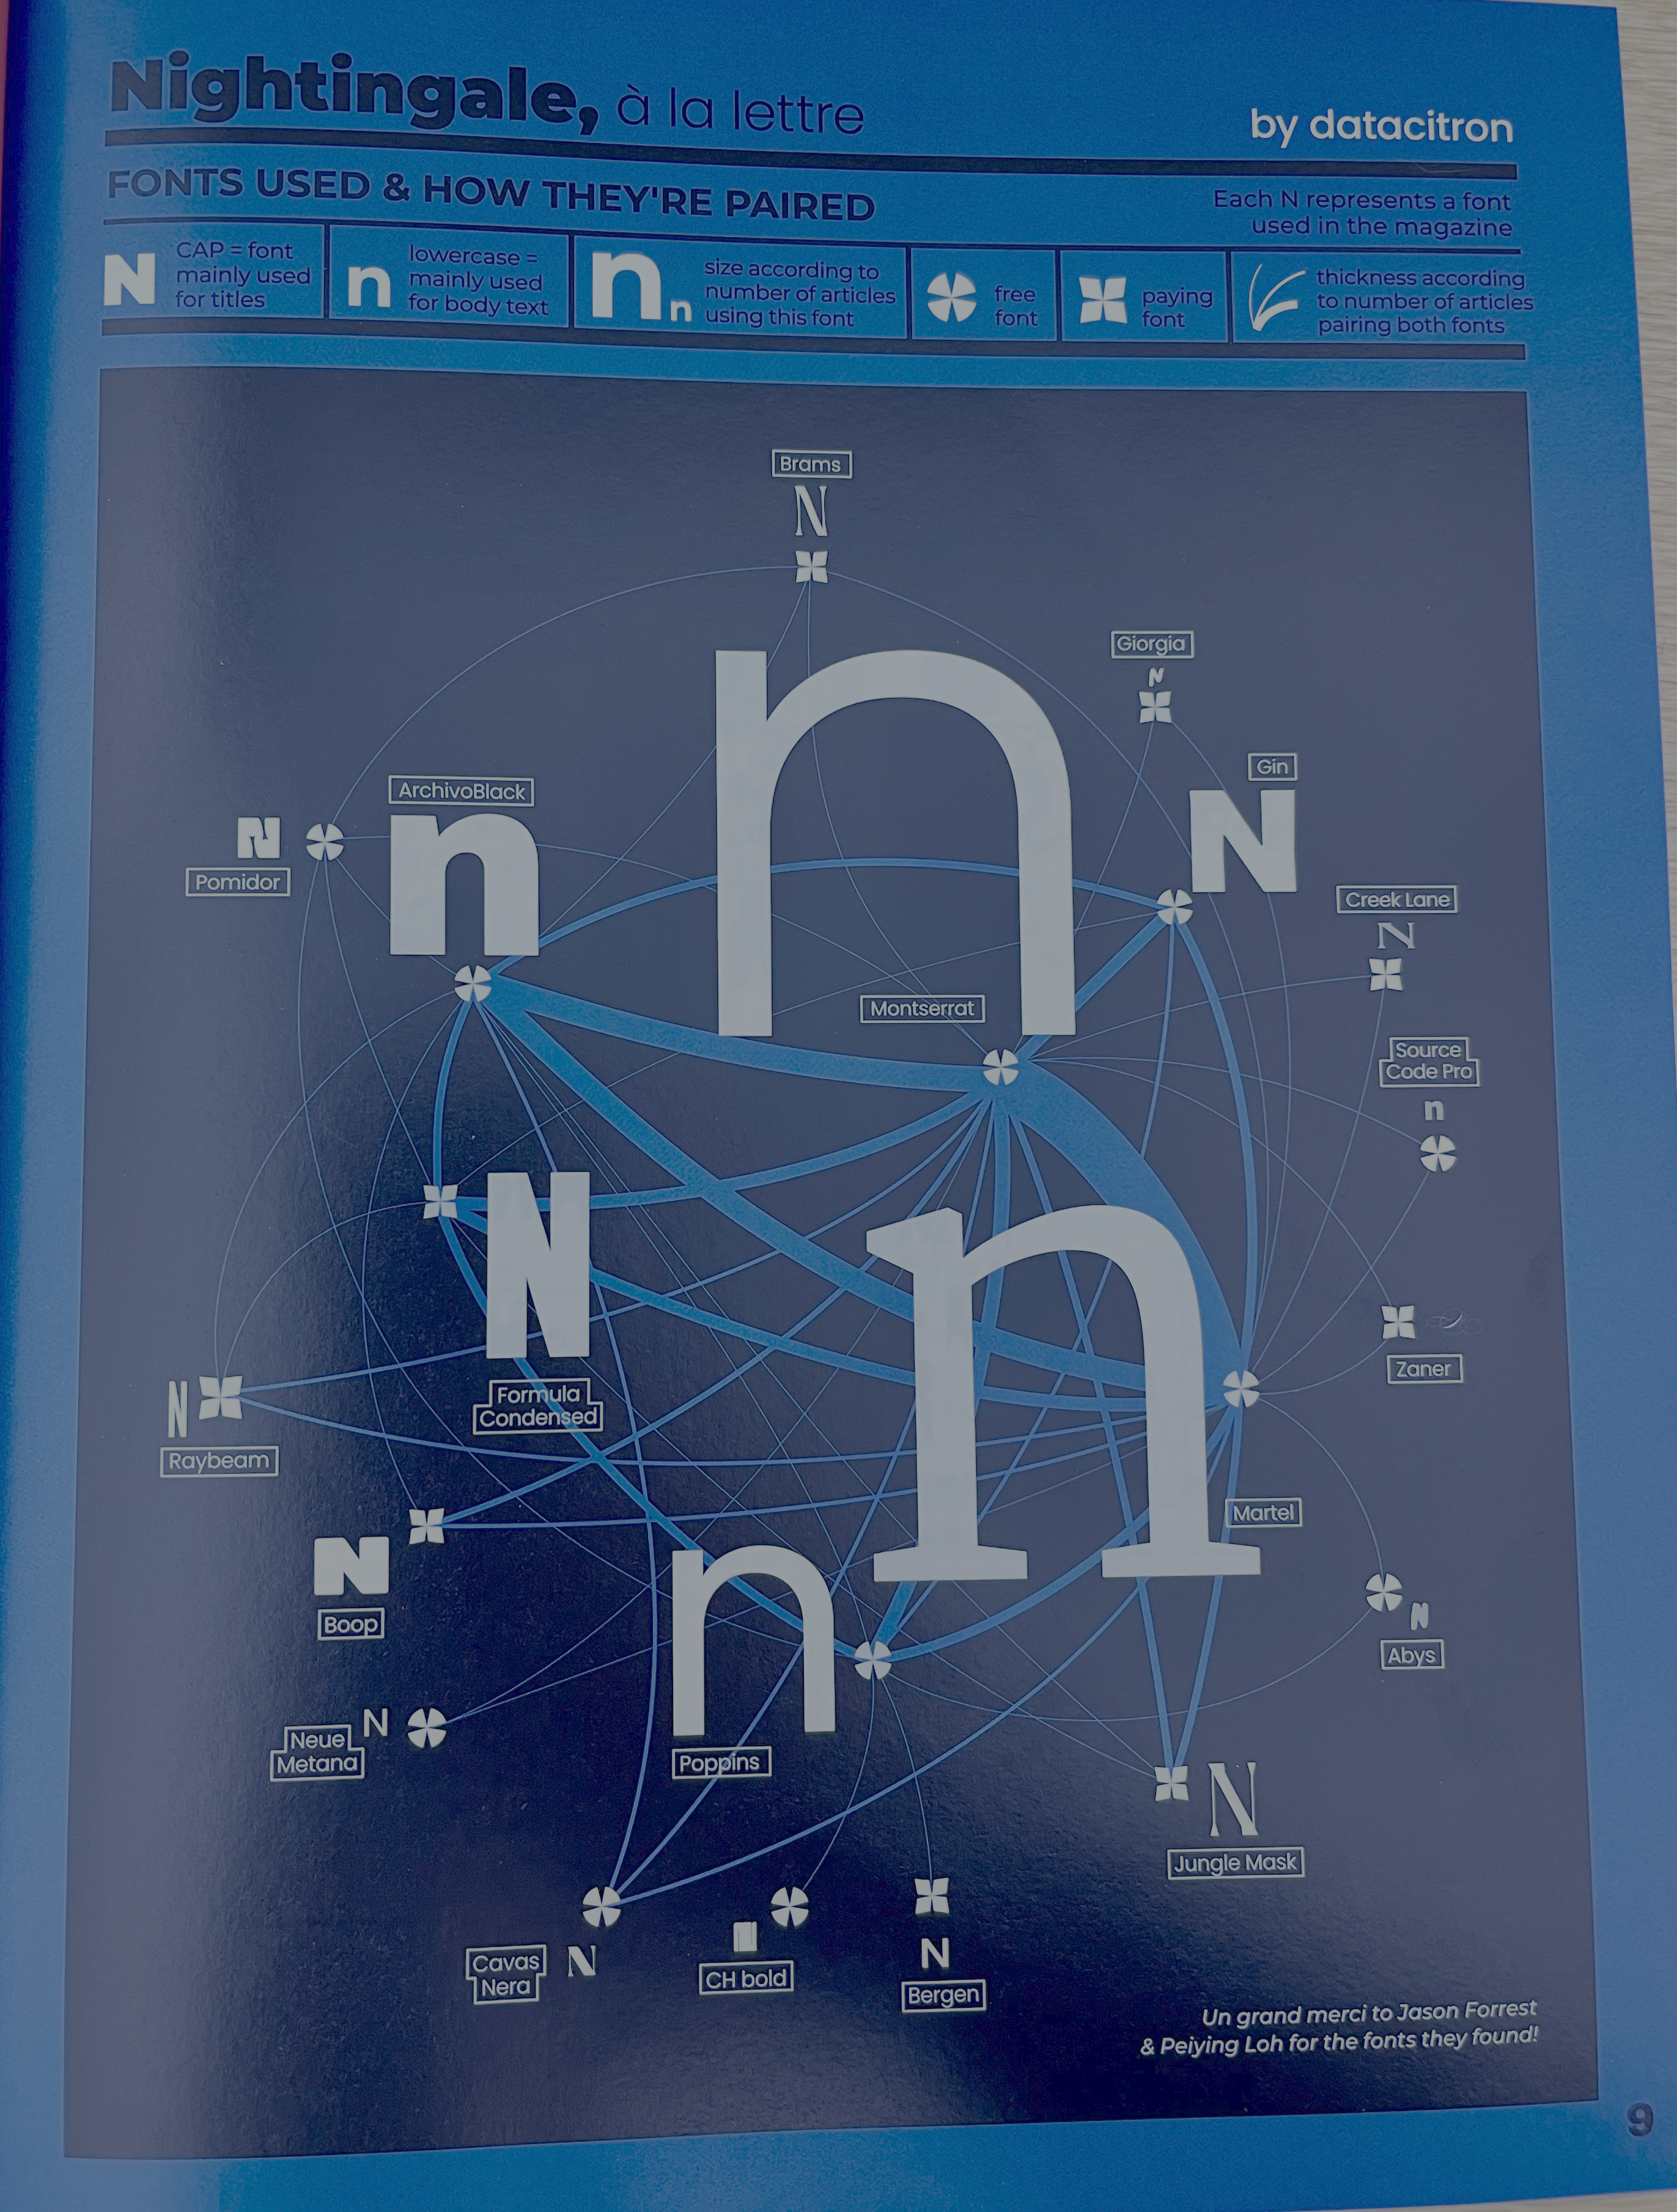
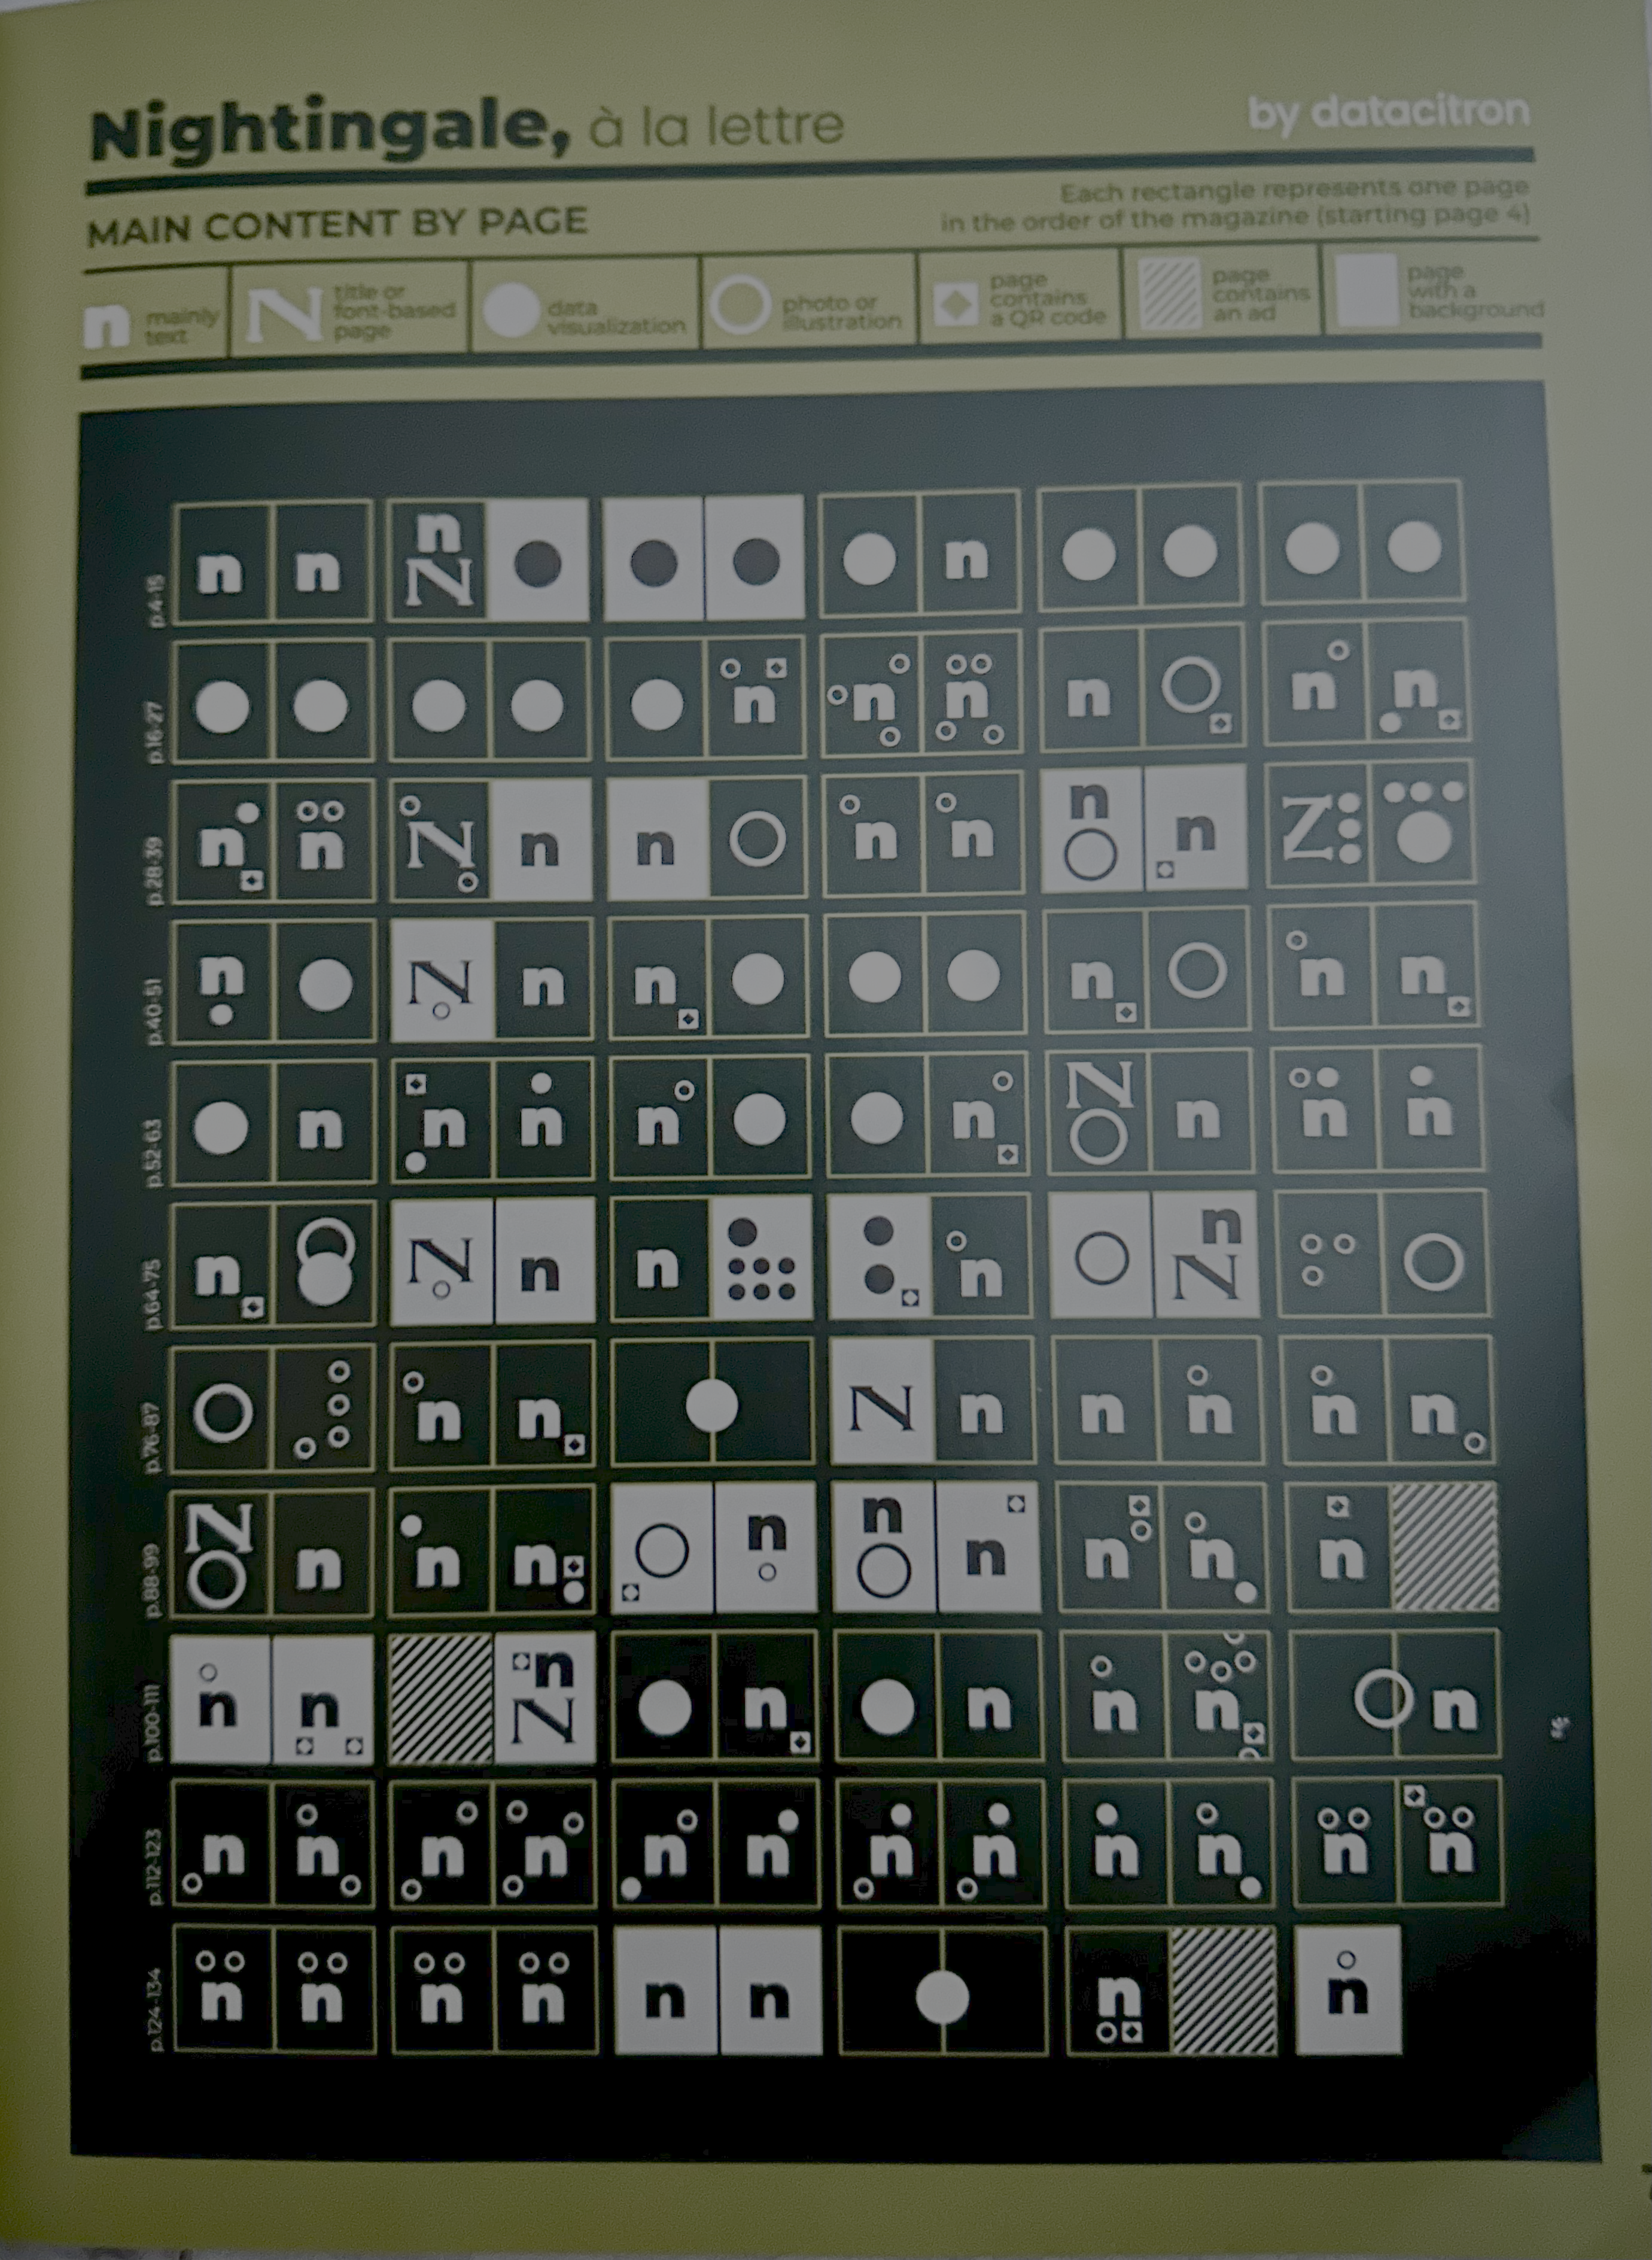
With all that in mind, I will make the review as unbiased and helpful as I can. And straight away, what sets this apart as such a pleasurable book to read is its visual appeal. With an edit and style full of visual elements on every page, it has the clear stamp of Julie Brunet (known as DataCitron) lending it an aesthetic that makes the book a joy to read. The first issues of the Data Visualization Society’s Nightingale magazine featured Julie’s graphic style, with “meta” data visualisations before the magazine even began, whether analysing fonts used on every page (below left) or visualising content breakdown per page in an eye-catching small multiple grid (below right). Both of these made me love each magazine issue before I’d even started.
And in the inside cover of Chart, we see another DataCitron idea – every one of the author’s projects referred to in the book, visualised simply with astronomy-style rings to distinguish between professional and personal style projects. So, once again, my mindset was set to creative and sometimes quirky visualisation style before the book had started.

On to the book itself, every chapter introduces a new creative concept and is illustrated throughout by one of more of Nadieh’s data visualisation projects. Chapters are arranged into four sections – not necessarily chronological in terms of her career, but with each section moving further from conventional towards data art, in what is described informally as the Chart-Art spectrum. The four sections are as below:
Staying Close to Ordinary Charts looks at design techniques she has used that inject creativity and impact into the most standard of chart types, or that have enhanced such standard chart types in a way that makes them more memorable and effective.
Getting Creative is just that, looking at more creative alternatives that start to bend some of the traditional dataviz design best principles.
Aiming for Visual Diversity focuses on disaggregation of often very large datasets, in order to build them back up in the most creative, diverse and distinctive of ways, to add more context and depth to the end result.
Diving into Data Art is the far side of the chart-art spectrum, looking at some of Nadieh’s spectacular entries into the field of data art.
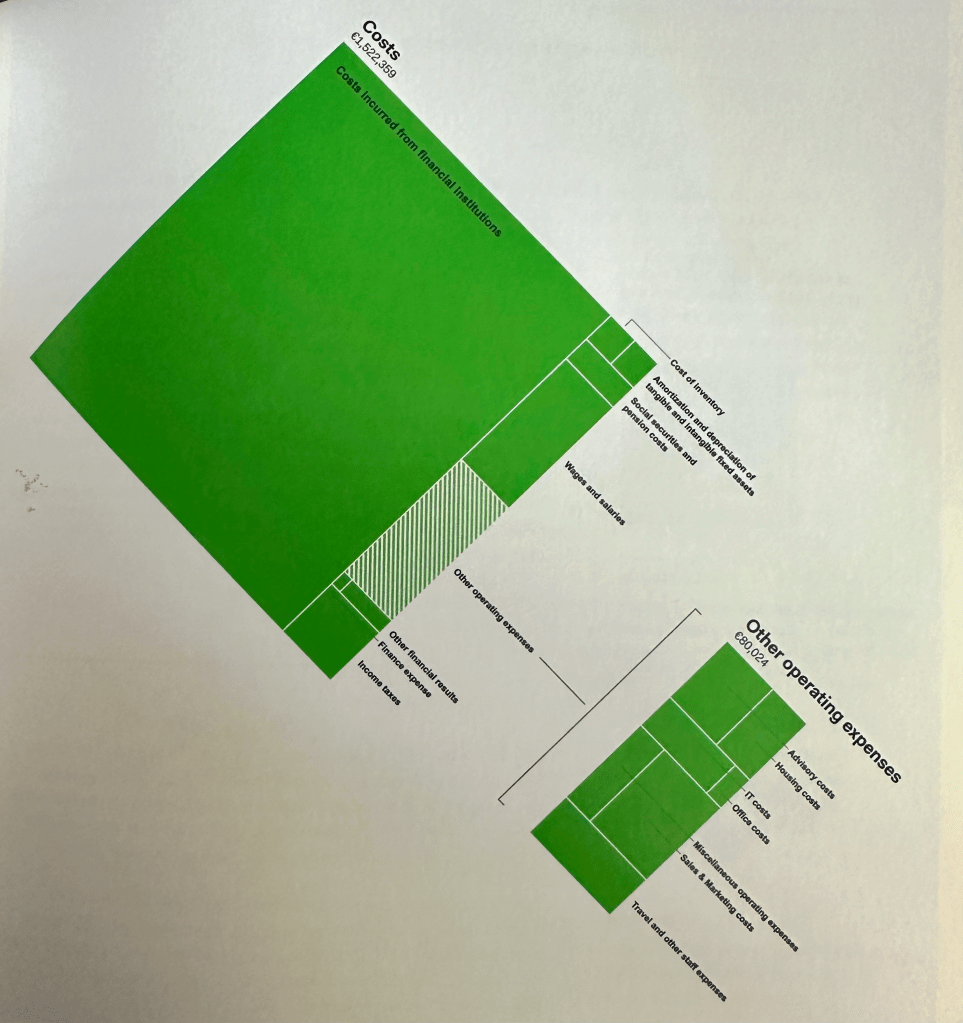
This graduated journey from conventional chart to pure data art allows the reader to see where they are most comfortable challenging conventions and breaking the dataviz mould. Immediately the first section encourages us to find unique elements to our charts, look for uncommon chart types, broaden our horizons, combine chart types and use circular shapes. One of the seemingly simplest examples here was in the selection and angled design of an otherwise simple treemap. Relatively rare enough as to have a novelty value to make the chart for the client more intriguing and memorable, with the additional visual interest of the angled presentation. Small touches that are still enough to make it almost uniquely Nadieh Bremer.
I was then struck by a concept in the second section (Getting Creative): the chapter dealing with Amplified Encoding. We’ve all heard that you don’t encourage double encoding without good reason, right? If our bar charts are doing what bar charts do, namely encoding values with length, we don’t need colour encoding too. Or we don’t need our shape marks all to have different colours or positions in space. What about the cognitive load – isn’t it bad to add to it with additional encoding methods? But in this chapter we’re encouraged to double encode. Or even to keep going – triple encode maybe? Amplified encoding can really increase impact and memorability. Below we see trees per country encoded by colour, shape and opacity. And the charts on the right show single numbers encoded in squares and multiple colours in an exercise in visualising simple single numbers in eye-catching ways.

By the third group of chapters (Aiming for Visual Diversity), we start to contradict many of the usual rules and thoughts when visualising first thoughts, especially large datasets. We’re encouraged to show all the data. To show granular data with aggregates. Add more variables (close your eyes, BI managers!). All the things that we are discouraged from doing, especially in the world of business intelligence. Of course, my particular delight at some of the ideas here is because they resonate so much with my own rule-bending and principle-questioning preferences too (especially to see US counties visualised in flower form!).
I could show so many examples to illustrate this section, but there is almost no better example than Satellites in Space. Full of disaggregated data, multiple encodings, shapes and colour shades with every data point in full view. A visualisation to read over and again, to devour and to appreciate. Always leading to intrigue and a memorable experience.

Nadieh’s visualisations, always with thought processes explained and often with first, second, third and nth drafts displayed and discussed, are always visualisations that I would consider worthy of displaying on a poster on my wall – I’ve often stated that as my own goal for creative and artistic (but definitely non-business) dashboards. Every one hits that criterion in this book, business charts included, and that’s before we even reach the section on data art! Within the data art section, I’ll tease you with text subheaders such as “Embracing the taboo with 3D bars” and “Embrace the randomness”, along with the chapter heading “In data art, the overarching theme or topic of the data holds more design significance than the precise figures.”
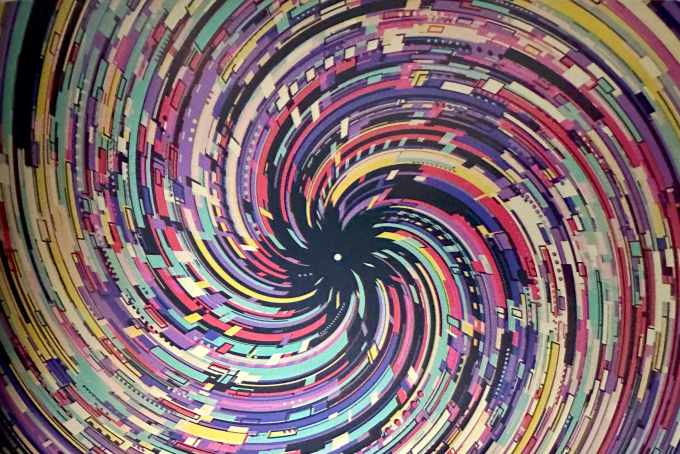
The results are, as you might expect, beautiful. I’ll choose for my visual example this phone-snapped snip of the data art piece that actually forms the book’s cover art (so as not to divulge even more of the images in the book). This spiral image is inspired by visualising the spiralling shapes of exoplanets around the earth.
I’ll leave the final thoughts to the experts. In the book’s foreword, Alberto Cairo and Tamara Munzner state simply first that “Nadieh belongs to a new generation of visualization designers who explore boundaries and cross them” and that the book “reminds us that the language of visualization doesn’t always need to remain static, and that expanding it can be thrilling.” In other words, this book is a beautifully documented invitation to people (like me) to follow into areas where the likes of Nadieh have led. And I’m here for the thrill of it!

1 Comment